
Landian Market Report · September 2026
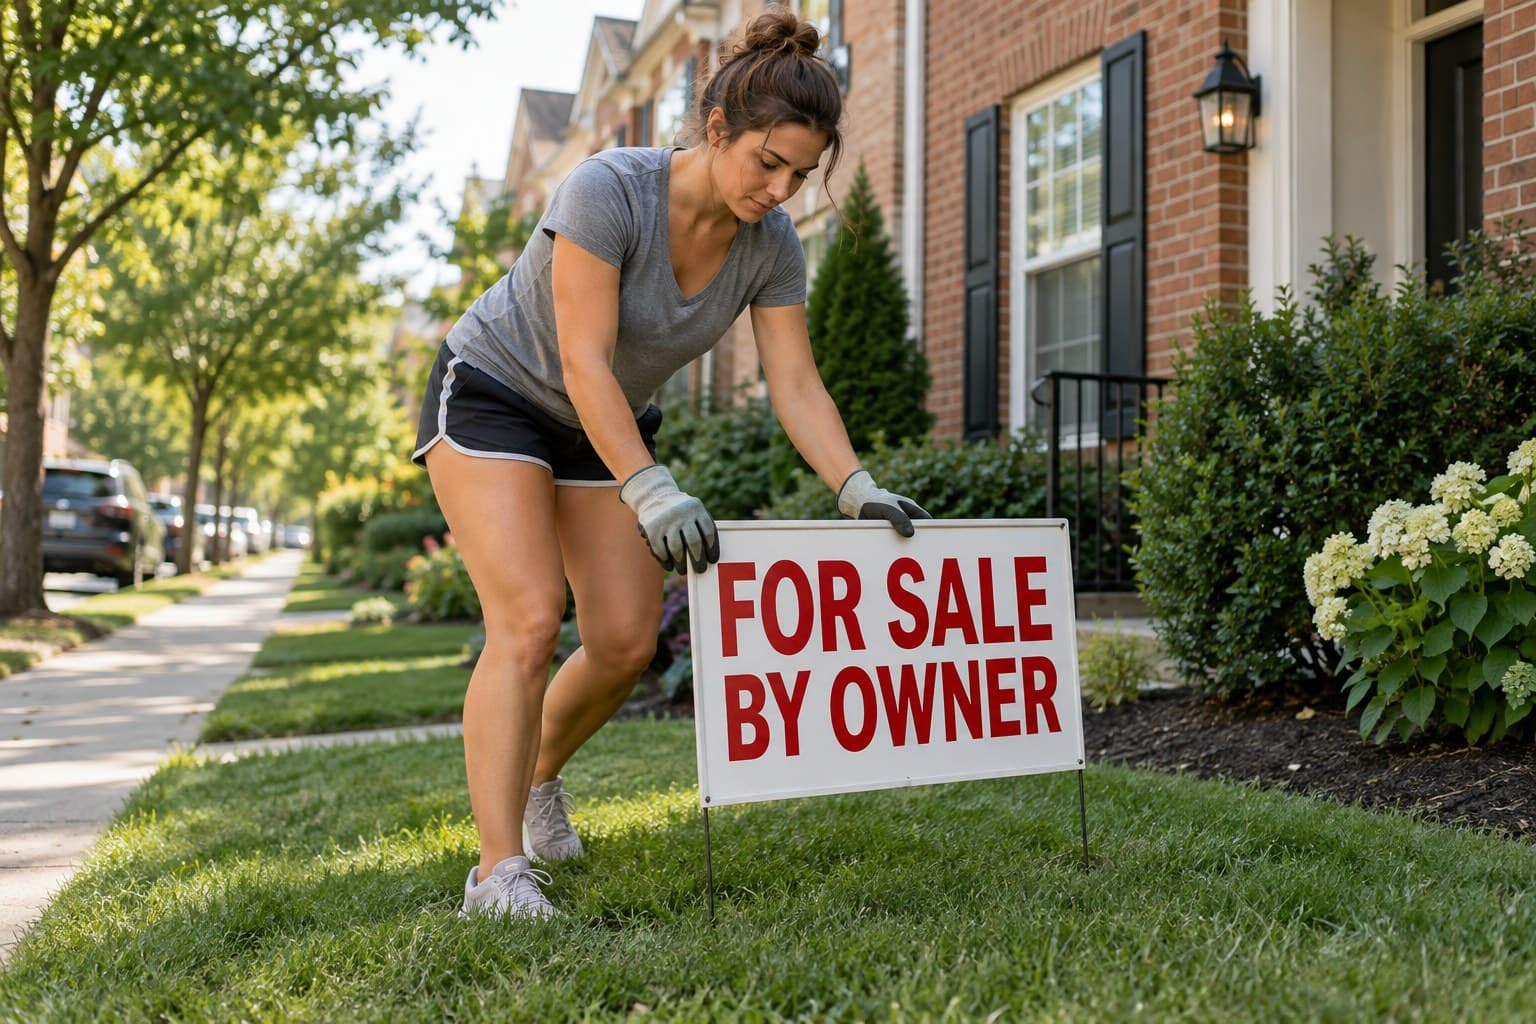
36,109 US Homes Are For Sale by Owner Right Now, and Only 5% of Sales Close That Way.
September 26, 2026 · Revised September 28, 2026 · Landian · The Landian FSBO Index
Key findings
- 36,109 homes are listed for sale by their owners on Zillow across the 50 states, DC and Puerto Rico, at every price, as of 2026-09-28. Florida leads with 4,187, then Texas (2,940), California (1,926), New York (1,508), Pennsylvania (1,426).
- Quebec has 7,851 on DuProprio, the province’s for-sale-by-owner platform, and Canada’s total is 11,089: Quebec 7,851, Ontario 1,886, Alberta 483, British Columbia 190. Quebec is the one North American market where selling without an agent is ordinary; its count is not directly comparable with a US state’s, because DuProprio is close to a census of Quebec owner-sellers while Zillow carries only part of America’s.
- Listed is not the same as sold. NAR’s 2025 Profile puts for-sale-by-owner deals at 5% of US sales, about 203,000 a year, and finds that 60% of those sellers already knew their buyer and 40% never marketed the home at all. The index counts the owners who list publicly; it is a barometer, not a census.
- Only 28% of US owner listings are priced above $400,000 (10,117 homes). In that segment, Florida’s owner listings fell 12.6% between April and September in Landian’s pilot series and were still slipping in September (−1.5%), while Maine (+72.1%), Hawaii (+16.8%), Puerto Rico (+14.9%), New Mexico (+13.9%) rose. The pilot is reported only for the 12 jurisdictions where it proved accurate.
- US owners above $400,000 are asking a median $599,000 (645 listings captured in the last 30 days), from $737,000 in California to $472,500 in Kansas.
The week the 30-year mortgage rate crossed 7% for the first time in 20 months, Redfin was reporting the widest gap between home sellers and buyers it has ever measured, and the two-year anniversary of the NAR commission settlement had reporters asking again whether American sellers would ever stop paying 5% to 6% to move house. Underneath those headlines is a decision hundreds of thousands of homeowners make each year and that almost nobody tracks in real time: whether to sell the house themselves.
The Landian FSBO Index tracks the ones who do it in public. Every day, Landian’s coverage monitor counts the owner-listed homes on the dominant for-sale-by-owner venue in each of 65 jurisdictions: Zillow’s state listings for the 50 US states, the District of Columbia and Puerto Rico; DuProprio for Quebec; and Kijiji’s owner-only real-estate listings for the other nine provinces and three territories. It counts every price point, and separately the homes priced from 400,000 to 4 million in local currency. This is the first monthly edition, and its clearest finding is how thin the American owner-listed market is next to the one province that built a venue for it.
Quebec is what a market without mandatory commissions looks like
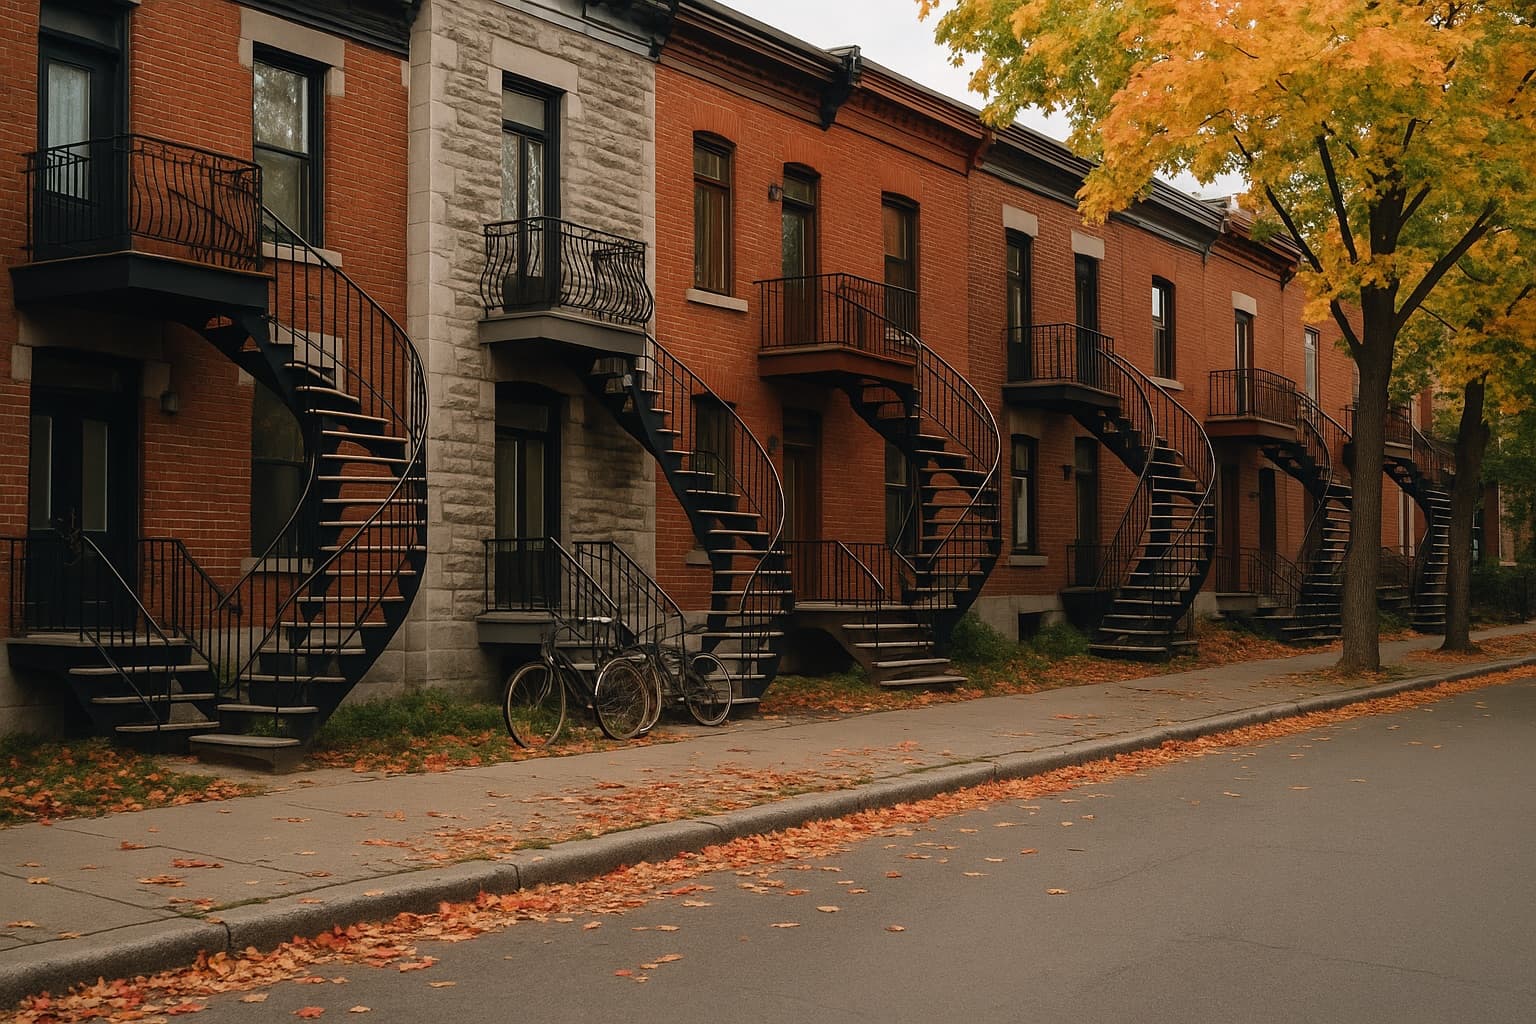
Montreal’s plexes. Quebec owners list 7,851 homes on DuProprio, the province’s own for-sale-by-owner venue.
On 2026-09-28, DuProprio carried 7,851 owner-listed properties at every price, in a province of about 9 million people. The same day, Zillow carried 4,187 owner listings in Florida, the largest for-sale-by-owner market in the United States, 2,940 in Texas, 1,926 in California and 1,508 in New York.
Those two numbers are not the same measurement, and the index does not treat them as one. DuProprio is close to a census of Quebec’s owner-sellers, because it is the platform every Quebec buyer already checks; Zillow is the largest public venue for American owner-sellers but far from all of them, and NAR estimates only 5% of US sales are for-sale-by-owner, a record low, with most of those sellers handing the keys to someone they already knew. What the Quebec count does show is what a market looks like when selling without an agent is ordinary and has a venue of its own: thousands of owner listings in one province, two years after a settlement that was supposed to loosen the commission’s grip south of the border.
The map of owner-listed homes
Across the United States, 36,109 homes were listed by their owners on Zillow on 2026-09-28, at every price. Across Canada, 11,089 were listed on DuProprio and Kijiji. Only 28% of the US listings (10,117) are priced above $400,000, which is where the second column and the pilot columns come from. The table lists every jurisdiction the index tracks; jurisdictions under 40 listings are shown for completeness, but their percentages should not be read as trends.
| Jurisdiction | Owner listings, all prices | Priced 400K–4M | Pilot (400K+): since April | Pilot (400K+): since August |
|---|---|---|---|---|
| Quebec QCC$ | 7,851 | 5,110 | — | — |
| Florida FLUS$ | 4,187 | 1,158 | −12.6% | −1.5% |
| Texas TXUS$ | 2,940 | 663 | — | — |
| California CAUS$ | 1,926 | 989 | — | — |
| Ontario ONC$ | 1,886 | 1,194 | — | — |
| New York NYUS$ | 1,508 | 749 | — | — |
| Pennsylvania PAUS$ | 1,426 | 211 | — | — |
| North Carolina NCUS$ | 1,320 | 340 | — | — |
| Illinois ILUS$ | 1,297 | 194 | — | — |
| Michigan MIUS$ | 1,285 | 239 | — | — |
| Ohio OHUS$ | 1,174 | 173 | — | — |
| Georgia GAUS$ | 1,079 | 329 | — | — |
| Louisiana LAUS$ | 1,048 | 153 | — | — |
| Alabama ALUS$ | 1,038 | 181 | — | — |
| Missouri MOUS$ | 1,016 | 189 | — | — |
| Arkansas ARUS$ | 951 | 197 | — | — |
| Arizona AZUS$ | 937 | 255 | +8.1% | +0.4% |
| Tennessee TNUS$ | 933 | 298 | — | — |
| Kentucky KYUS$ | 896 | 192 | — | — |
| Indiana INUS$ | 861 | 148 | — | — |
| Iowa IAUS$ | 842 | 213 | — | — |
| Oklahoma OKUS$ | 841 | 137 | — | — |
| South Carolina SCUS$ | 717 | 178 | — | — |
| Colorado COUS$ | 606 | 253 | +13.1% | −3.0% |
| Maryland MDUS$ | 572 | 106 | — | — |
| New Jersey NJUS$ | 545 | 318 | — | — |
| Virginia VAUS$ | 537 | 184 | — | — |
| Alberta ABC$ | 483 | 186 | — | — |
| Mississippi MSUS$ | 438 | 104 | — | — |
| Oregon ORUS$ | 434 | 204 | — | — |
| Kansas KSUS$ | 388 | 63 | −2.3% | −3.8% |
| Nebraska NEUS$ | 339 | 91 | — | — |
| Minnesota MNUS$ | 333 | 110 | — | — |
| West Virginia WVUS$ | 324 | 54 | — | — |
| Idaho IDUS$ | 307 | 172 | — | — |
| Nevada NVUS$ | 306 | 110 | — | — |
| New Mexico NMUS$ | 296 | 83 | +13.9% | −8.2% |
| Utah UTUS$ | 294 | 164 | −4.2% | — |
| South Dakota SDUS$ | 234 | 53 | −11.6% | — |
| Washington WAUS$ | 233 | 127 | — | — |
| Massachusetts MAUS$ | 191 | 116 | — | — |
| British Columbia BCC$ | 190 | 93 | — | — |
| Saskatchewan SKC$ | 189 | 42 | — | — |
| Montana MTUS$ | 175 | 84 | — | — |
| Manitoba MBC$ | 165 | 47 | — | — |
| Connecticut CTUS$ | 155 | 73 | — | — |
| Puerto Rico PRUS$ | 153 | 73 | +14.9% | — |
| Maine MEUS$ | 135 | 48 | +72.1% | −2.8% |
| Hawaii HIUS$ | 129 | 71 | +16.8% | +9.7% |
| New Brunswick NBC$ | 126 | 33 | — | — |
| Wyoming WYUS$ | 126 | 47 | −23.7% | — |
| Vermont VTUS$ | 122 | 49 | — | — |
| Nova Scotia NSC$ | 121 | 26 | — | — |
| Alaska AKUS$ | 119 | 50 | — | — |
| North Dakota NDUS$ | 118 | 25 | +3.7% | — |
| District of Columbia DCUS$ | 89 | 27 | — | — |
| Delaware DEUS$ | 78 | 26 | — | — |
| New Hampshire NHUS$ | 69 | 27 | — | — |
| Newfoundland and Labrador NLC$ | 38 | 5 | — | — |
| Rhode Island RIUS$ | 35 | 18 | — | — |
| Prince Edward Island PEC$ | 34 | 15 | — | — |
| Wisconsin WIUS$ | 7 | 1 | — | — |
| Yukon YTC$ | 5 | 2 | — | — |
| Northwest Territories NTC$ | 1 | 0 | — | — |
| Nunavut NUC$ | 0 | 0 | — | — |
Counts are the latest daily observation. US$ for US jurisdictions, C$ for Canadian ones. The pilot columns are Landian’s April–September 2026 rectangle series for listings priced 400K and up (see the method note), shown only for the 12 jurisdictions where the rectangle matched the exact count within 10%: Arizona, Colorado, Florida, Hawaii, Kansas, Maine, North Dakota, New Mexico, Puerto Rico, South Dakota, Utah, Wyoming. Wisconsin reads low because Zillow carries only a handful of owner listings there. Not seasonally adjusted.
Florida, and what six months of pilot data can say
Before switching to exact state boundaries on September 27, the index ran a six-month pilot that counted Zillow listings priced $400,000 and up inside a rectangle drawn around each state. For most states the rectangle took in neighbouring metros (New Jersey’s held New York City and Philadelphia), so their pilot figures are not reported. For the 12 jurisdictions where the rectangle and the exact count agreed within 10%, the pilot is a usable six-month record, and it says something specific about the Sun Belt.
Florida’s owner listings above $400,000 fell 12.6% between April and September and were still slipping (−1.5%) from August to September. That matches what Florida’s own data shows: Florida Realtors reported a double-digit drop in statewide inventory in August, not because homes sold but because sellers pulled their listings, with the median single-family home now taking about 84 days to sell. Redfin’s September 10 analysis put the seller surplus at a record 57.9% nationally and named the Sun Belt as the driver. When a market turns against sellers, owners selling on their own appear to retreat first: they have no agent urging patience, and every extra month costs them time they were not paid to spend. Elsewhere in the clean set the pool grew: Maine (+72.1%), Hawaii (+16.8%), Puerto Rico (+14.9%), New Mexico (+13.9%). Across the 12 clean jurisdictions together, owner listings in this segment moved −4.1% since April and −1.6% from August to September, as the 30-year rate reached 7.03% (Freddie Mac, September 24) and existing-home sales fell 2.0% in August to a 3.98 million annual pace (NAR).
What FSBO sellers are asking
The index counts listings; Landian’s seller pipeline also captures what US owners are asking in the $400,000-plus segment. Among the 645 owner-listed homes the pipeline captured between 2026-08-30 and 2026-09-28, the median asking price was $599,000, with the middle half of listings between roughly $473,000 and $859,900. Because the pipeline only tracks homes above $400,000, these figures describe the upper-middle of the market rather than the typical FSBO sale, which NAR put at $360,000 in its 2025 Profile.
| State | Listings | Median asking |
|---|---|---|
| California | 104 | $737,000 |
| Colorado | 40 | $625,500 |
| Florida | 80 | $604,500 |
| Kentucky | 39 | $599,999 |
| Washington | 47 | $599,900 |
| Virginia | 15 | $595,000 |
| Arizona | 86 | $594,000 |
| Alabama | 37 | $565,000 |
| Illinois | 15 | $525,000 |
| Louisiana | 31 | $499,985 |
| Kansas | 18 | $472,500 |
US listings priced $400K+ with 0–14 days on market at capture; states with at least 15 listings in the window.
What it means
- The commission debate has a control group. Two years after the NAR settlement, 36,109 American owners are listing publicly on Zillow at any given time, against roughly 203,000 for-sale-by-owner sales a year, most of them to people the seller already knew. Quebec, where an owner can list on a platform every buyer already uses, has 7,851 owner listings in one province. The difference is not the sellers; it is the infrastructure.
- For sellers: in Florida and the rest of the Sun Belt, with 58% more sellers than buyers and rates above 7%, the owners going it alone in the $400,000-plus segment are quietly giving up, and the Florida pilot shows it. Either way, the 2024 settlement means no seller has to bake a buyer-agent commission into the listing, and the commission itself is negotiable in writing.
- For buyers: 36,109 US homes and 11,089 Canadian homes are being sold directly by their owners right now. Those sellers are often open to a direct offer, and with the buyer’s agent fee now set in the buyer’s own agreement, the savings on a $600,000 home can run to five figures.
- For agents: the largest owner-listing pools are Quebec, Florida, Texas, California, Ontario and New York. US owners above $400,000 are pricing at a median $599,000, well above the typical FSBO sale, and NAR’s data says most of them will need help before they close.
About the Landian FSBO Index
The index is a daily count of active for-sale-by-owner listings, taken from the dominant owner-listing venue in each market: Zillow’s own state listings (not a map rectangle) for the 50 US states, the District of Columbia and Puerto Rico; DuProprio for Quebec and Kijiji real estate with the for-sale-by-owner filter (houses and condos) for the other provinces, Yukon and the Northwest Territories, with Nunavut taken as Kijiji’s Territories total minus Yukon and the NWT. Every jurisdiction is counted at all prices and again in the 400,000 to 4,000,000 band in local currency. Guam and the US Virgin Islands have no usable source. No listing details are collected; every figure is a count or an aggregate, and no address, owner or photo is identified. The official series began September 27, 2026; month-over-month comparisons appear from the December edition and six-month trends from April 2027. Zillow carries very few owner listings in Wisconsin, so that state reads low.
Coverage: the US count is a barometer of publicly marketed owner listings, not a census of every private sale. NAR’s 2025 Profile of Home Buyers and Sellers estimates for-sale-by-owner deals at 5% of the 4.06 million existing homes sold in 2025, and reports that 60% of those sellers knew the buyer, 40% did not actively market the home, and about one in ten used a listing aggregator such as Zillow. DuProprio, by contrast, is where most Quebec owner-sellers list.
The pilot: from March 31 to September 27, 2026, Landian counted Zillow owner listings priced $400,000 and up inside a bounding rectangle around each jurisdiction. Rectangles overlap neighbours, so the pilot is reported only for the 12 jurisdictions where its count matched the exact state count within 10% on the day both were measured, and never for Canada, where Zillow has no owner-listing inventory. It is not seasonally adjusted and has no year-over-year comparison.
For media: the full jurisdiction table, the daily series and the method are available on request for journalists and researchers. Email hello@landian.co with the subject “Landian FSBO Index.” Please cite as “Landian FSBO Index, September 2026” with a link to this page. The next edition publishes November 1, 2026, covering October.
Landian matches home buyers and sellers with licensed local agents for a flat fee set by the home’s price before the client meets the agent and under 1% on homes over $500,000. See how it works at landian.co.
Sources: Landian FSBO Index and seller pipeline (counts as of 2026-09-28; asking prices through 2026-09-28); DuProprio and Kijiji search totals (2026-09-28); Freddie Mac Primary Mortgage Market Survey (Sep 24, 2026); Redfin, It’s Now the Strongest Buyer’s Market on Record (Sep 10, 2026); Realtor.com August 2026 Monthly Housing Report (Sep 2, 2026); National Association of Realtors, Existing-Home Sales, August 2026, 2025 annual sales (4.06 million), and 2025 Profile of Home Buyers and Sellers (Nov 2025); Florida Realtors, Tight inventory helps Florida prices hold firm (Sep 2026). Landian figures are counts of active listings and asking prices, not sales, and vary by market.
Corrections: the version of this report published on September 26 counted listings inside a rectangle drawn around each state and province; those rectangles included neighbouring metros and, for Canada, returned US listings rather than Canadian ones, so its state-by-state figures and national six-month change (up 9.5% since April) were overstated or wrong. The September 27 revision fixed the sources but reported only listings priced $400,000 and up, which understated the size of the owner-listed market. This version counts every price point, keeps the $400,000-plus segment as a secondary series, and reports the pilot only where it proved accurate.